
This is a continuation of the cluster analysis puzzle. In this puzzle, we had noticed different results for k-mean clusters in different runs. Some of you (Emily. Ramya, Alard, and Pintu) have pointed out initial random seeds as the reason for this inconsistency.
Now, this inconsistency of results is a big problem for cluster analysis. In this article, we will collectively try to come up with solutions to this problem. I will again ask a few questions. Again, your answers will provide directions and help move things forward. So, please participate and share your thoughts in the comments section. Remember, there are no wrong answers.
Before we move further, to creatively think about this problem let me create a few links between…
Initial Random Seeds and Human Success
Rahul Gandhi is an Indian politician. In 2013, he made a speech for which he was mocked and criticized endlessly. He compared a concept in physics, escape velocity, with social upliftment. Let me first try to explain escape velocity. When you throw a ball up in the air, it invariably comes back to the ground because of Earth’s gravitational pull. If, however, you throw the ball with enough force for it to generate the escape velocity, i.e. 11.2 km/sec for Earth, it will fly away to space and will not return back on Earth.
In his speech, Rahul Gandhi was addressing a section of Dalits, historically an oppressed class in India. He said Dalits need Jupiter’s escape velocity to succeed in their lives on Earth. Noticeably, Jupiter’s escape velocity is more than 5 times the escape velocity of Earth. In short, Dalits need to work much harder to succeed than other communities. Rahul Gandhi’s detractors didn’t like his argument as they believe that in the modern India everyone has an equal opportunity to succeed.
Does Initial Disadvantage Persists? – Random Seeds & Cluster Analysis
Let’s evaluate the argument about different escape velocity for different people. To do so, we will look at some evidence from the recent research in sociology and economics. Being a data science blog, I must present the data from a couple of research papers. The first paper from Harvard University estimates the influence of their neighborhood on children’s test scores. Another paper by National Bureau of Economics Research, Massachusetts, estimates the influence of a kid’s kindergarten test score on his salary as an adult.

These results clearly show that the initial disadvantage in life – upbringing and neighborhood – persists with their salary as adults. This means a person brought up in a poor neighborhood has to work extra hard to get the same salary as a person brought up in a middle-class neighborhood.
Nobody Conspires – Initial Random Seeds & Cluster Analysis
It may seem that the society always deliberately conspires and oppresses certain communities and individuals. Malcolm Gladwell, however, argues that sometimes this conspiracy is completely random and unintentional. In his fascinating book Outliers – the Story of Success, he highlighted the research work of Roger Barnsley about players in the Canadian Hockey League. Barnsley observed the following patterns in the birth months of the players in the hockey league.

One would expect an even distribution i.e. close to 25% across the birth months of players in four quarters. However, there are 4 times higher players born in the January-March quarter than October-December. There is also a consistent downward trend. What is going on here? First of all, astrology has nothing to do with these anomalous results i.e. Aquarius are not better hockey players than Sagittarius.
Apparently, this discrepancy is the result of an innocent decision by the hockey association while setting the cutoff date for each age group. Importantly, the eligibility cutoff for age-class hockey (where the boys are grouped according to age) is 1st of January. This means that everyone born in the year 2008 is a 10-year-old in 2017. However, boys born in January 2008, although they are 10-year-olds on paper actually are almost a year older than boys born in December 2008. This one year difference in age has a huge significance as it is like an 11-year-old competing against a 10-year-old. Clearly, all things equal, the boys born in January have a better chance of selection to qualify for better training and facilities. Hence, the initial advantage for these boys continues as adult hockey players. This is kind of similar to random seeds in cluster analysis.
Initial Random Seeds and Cluster Analysis
In the previous part of this cluster analysis puzzle, we ran the k-mean cluster with two different initial random seeds and got completely different results. Remember, we had started with the initial choice of the clusters as 3 i.e. k=3. Essentially, the algorithm had generated 3 random points (aka cluster centroids) on the XY-plane. These centroids were then iteratively moved to get the final clusters. Read this cluster analysis case study to understand this iterative process.

I am sure by now, you must have figured that the positions of initial random seeds are responsible for these different results. This is similar to human success and their initial circumstances.
Human Success and K-Mean Optimization
The two most important requirements for major success are: first, being in the right place at the right time, and second, doing something about it.
– Ray Kroc
Imagine, as humans, we are allowed to live multiple times in different times and eras with different surroundings and circumstances. In all these different lives we will have different levels of success. In this case, a good question is: how would one define and measure success? Is having wealth or having friends a good measure of success? Is it about achieving power or achieving peace in life?
 This is essentially what we will do in the k-mean clustering algorithm to produce consistent results. In short, we will make cluster centroids live multiple lives and choose the most successful centroids. The essential thing here is to define success. Note, like different humans can have different definitions for success in life, definitions for successful cluster centroids can also differ for different problems in hand. Also remember, using the textbook definition of successful clusters is like using someone else’s definition of success for your life. It may or may not work.
A few Questions
On this note, let me pose a few questions for you to mull over
| 1) What are the success factors that you will consider to define perfect clusters? I suggest you look at the data we are working with to define your factors in plain and simple English.
2) Think of ways to measure your success factors for perfect cluster centroids and report your results. 3) Could you think of reasons why your factors will fail to generate successful clusters on some other datasets? 4) Finally, how will you make the initial random seeds spread across the data for them to maximize their chances of success? Don’t forget your initial seed needs to achieve success fast as well. |
R Code for Multiple lives of Cluster Centers
There are many great minds who have pondered on the same questions that you were trying to answer in the previous section. They have come up with some good strategies. However, these questions are still open for better and creative answers. I would love to hear your solutions. We will use a package in R to make the centroids live many lives. First, let’s download our original data through the following line of code.
a = read.delim('http://ucanalytics.com/blogs/wp-content/uploads/2017/01/Cluster-Analysis-Data.txt',sep = ",",header = T)
Now, we will run the k-mean clustering algorithm 100 times and measure the most successful centroids. We will use the fpc package for this with the following lines of code. Notice, we have defined the value of k = 3 in the kmeansruns function.
install.packages("fpc")
require(fpc)
kmeans = kmeansruns(a,3,runs=100)
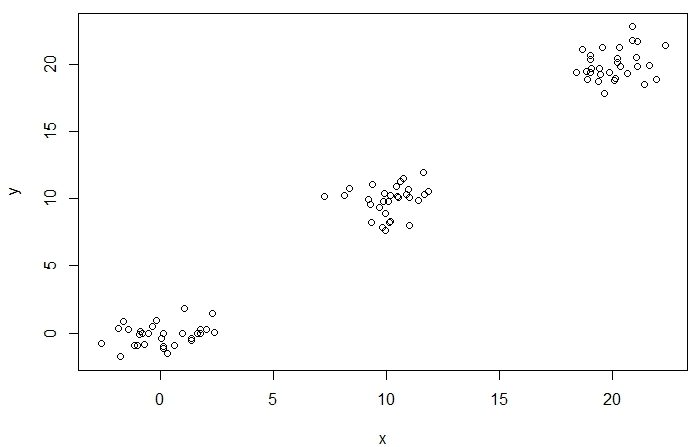
plot(a,col=kmeans$cluster,pch=16)
legend(-3,23,c('cluster 1','cluster 2','cluster 3'),pch=16,col=c("black","green","red"))
Moreover, you could run this code multiple times but each time you will get the same clusters. The effect of initial random seeds is neutralized by the kmeansruns function. These are the consistent results through multiple runs of the k-mean algorithm.

This brings us to another question.
| 5) What factors does kmeansruns use to measure the success of cluster centroids? |
Also, you run this piece of code where you are lettering kmeansruns identify the appropriate value of k by trying multiple values between 2 to 10.
kmeans1=kmeansruns(a,krange = 2:10,runs=100)
Finally, to reinforce your learning of kmeans clusters, I suggest you simulate some more datasets and use kmeansruns with different settings. I am sure you will find some surprising results. Let us know what you found.
Sign-off Note
Oh, I wish, like clusters optimization, we could create the most successful version of ourself by living in different times, places, and circumstances. Nature is not so kind but she has empowered us with a crucial thing: the ability to define the measure of one’s own success in life. Don’t follow other people’s measure of success as your own. It may or may not work for you.
Silhouette analysis can be used to study the separation distance between the resulting clusters.