logo
  • Home
  • Blog-Navigation
  • Art
  • About
  • Contact

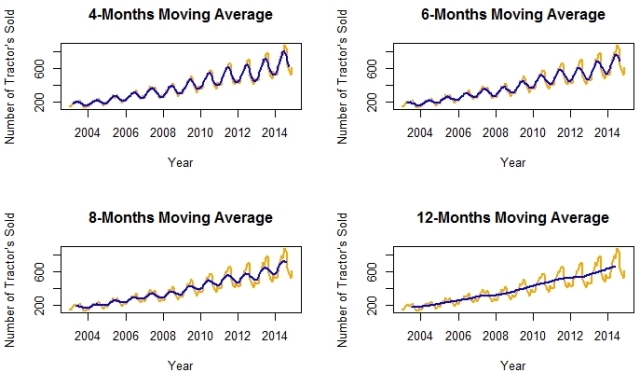
Rplot

Published May 23, 2015 - size: 640 × 372 in Time Series Decomposition – Manufacturing Case Study Example (Part 2)
← Previous
Post a comment or leave a trackback: Trackback URL.

Leave a comment Cancel reply

Your email address will not be published. Required fields are marked *

This site uses Akismet to reduce spam. Learn how your comment data is processed.

Subscribe to Blog

Provide your email address to receive notifications of new posts

Must Read

Career in Data Science - Interview Preparation - Best Practices

Free Books - Machine Learning - Data Science - Artificial Intelligence

Case-Studies

- Marketing Campaign Management - Revenue Estimation & Optimization

Customer Segmentation - Cluster Analysis - Segment wise Business Strategy

- Risk Management - Credit Scorecards

- Sales Forecasting - Time Series Models

Credit

I must thank my wife, Swati Patankar, for being the editor of this blog.

Pages

  • Blog-Navigation
  • Art
  • About
  • Contact
© Roopam Upadhyay
  • Blog-Navigation
  • Art
  • About
  • Contact