Today we are starting a new case study example series on YOU CANalytics involving forecasting and time series analysis. In this case study example, we will learn about time series analysis for a manufacturing operation. Time series analysis and modeling have many business and social applications. It is extensively used to forecast company sales, product demand, stock market trends, agricultural production etc. Before we learn more about forecasting let’s evaluate our own lives on a time scale:
Life is a Sine Wave

Time Series Analysis; Life’s Sine wave – by Roopam
I learnt a valuable lesson in life when I started my doctoral research in physics & nano-technology. I always loved physics, but during my doctoral studies, I was not enjoying the aspect of spending all my time in an isolated lab performing one experiment after another. Doing laboratory research could be extremely lonely. Additionally, I always enjoyed solving more applied and practical problems which I believed was missing in my research work. After getting frustrated for some time I decided to take some career advise from a trusted physicist friend. Before you read further, I must warn you that physicists as a community are usually mathematical, and occasionally philosophical. Physicists prefer to create a simple mathematical model about a complicated situation. They slowly add complexity to this simple model to make it fit with reality. The following is the key point I discovered during that conversation with my friend.
A simple model for life is a sine wave – where we go through ups and downs of moods and circumstances. Like a sine wave, we don’t spend much of our time either on the peaks or the troughs but most of our time is spent climbing up or sliding down. Now keeping these moods and circumstances cycle in mind, a perfect choice of career is where one could enjoy both climbs and slides – as the up and down cycle is inevitable in life.
Keeping the above in mind I prepared a list of keywords that I associated with a job that I can truly love to absorb the up and down cycle of life. The following is my list of keywords:
| Practical problem-solving | Mathematics | Creativity |
| Working with people on smart solutions | Scientific investigation | Learning every day |
| Seeing the fruits of my efforts reasonably fast | Producing quantifiable business benefits | Knowledge sharing |
This prompted me to change my career from laboratory research to data science and business consulting. I am lucky that my career in data science and business analytics for over a decade has allowed me to check mark all these keywords.
| Your work is going to fill a large part of your life, and the only way to be truly satisfied is to do what you believe is great work. And the only way to do great work is to love what you do. If you haven’t found it yet, keep looking. Don’t settle. As with all matters of the heart, you’ll know when you find it. And, like any great relationship, it just gets better and better as the year’s roll on. So keep looking until you find it. Don’t settle. – Steve Jobs |
Interference of Other waves
 Now in the true tradition of physics, let me add some complexity to the simple sine wave model for life. We live in a society and interact with many people. Everyone around us has a different shape to their lives’ sine waves. The interference of different regular and predictable sine waves can produce patterns that are highly irregular and could at times be close to randomness.
This is what is displayed in the adjacent chart where the product of four harmonic sine waves is an irregular shape at the bottom. Eventually, our actual lives’ function looks more like an irregular pattern produced through the interference of several sine waves.
| On some level the above is the fundamental principle behind Fourier series and Fourier transforms; most engineering and physics students will get a cold chill of fear at the mention of Fourier series. However, the basic idea is simple that the linear combination of sine and cosine functions (similar to our lives’ sine waves) can produce any complicated patterns including the irregular function we observed and much more complicated Fractals. I find it absolutely wonderful that a combination of harmonic motions can produce absolutely irregular patterns! |
Time Series Analysis – Decomposition
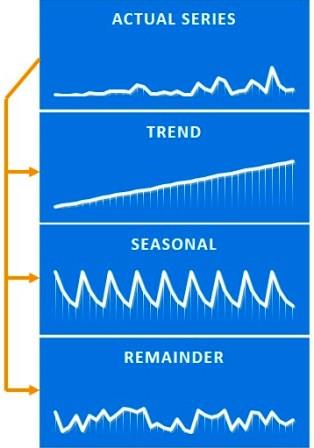
Now, let me try to create a connection between what we discussed above with time series analysis and forecasting. The fundamental idea for time series analysis is to decompose the original time series (sales, stock market trends, etc.) into several independent components. Typically, business time series are divided into the following four components:
- Trend – overall direction of the series i.e. upwards, downwards etc.
- Seasonality – monthly or quarterly patterns
- Cycle – long-term business cycles
- Irregular remainder – random noise left after extraction of all the components
Interference of these components produces the final series.
Now the question is: why bother decomposing the original / actual time series into components? The answer: It is much easier to forecast the individual regular patterns produced through decomposition of time series than the actual series. This is similar to reproduction and forecasting the individual sine waves (A, B, C, and D) instead of the final irregular pattern produced through the product of these four sine waves.
Time Series Analysis – Manufacturing Case Study Example
 PowerHorse, a tractor and farm equipment manufacturing company, was established a few years after World War II. The company has shown a consistent growth in its revenue from tractor sales since its inception. However, over the years the company has struggled to keep it’s inventory and production cost down because of variability in sales and tractor demand. The management at PowerHorse is under enormous pressure from the shareholders and board to reduce the production cost. Additionally, they are also interested in understanding the impact of their marketing and farmer connect efforts towards overall sales. In the same effort, they have hired you as a data science and predictive analytics consultant.
You will start your investigation of this problem in the next part of this series using the concept discussed in this article. Eventually, you will develop an ARIMA model to forecast sale / demand for next year. Additionally, you will also investigate the impact of marketing program on sales by using an exogenous variable ARIMA model.
Sign (Sine) off Note
Whether you like it or not, life inevitably goes through up and down cycle. A perfect career or relationship doesn’t make the variability disappear from our lives but makes us appreciate the swings of life. They keep us going in the tough times. They make us realise that variability is beautiful!
Hi Roopam, i’m a follower of your blog for quite a time now, i believe this is your crown jewel till now, i have been working on time series analysis for the last 8 years and this is the best explanation for trend and rationale for decomposing Time series, keep it up and looking forward for your next blog.
Thanks Khalid! It’s flattering to receive such an adulation from a long term professional of time series analysis. Hope you will enjoy the remaining parts as well.
Thanks roopam. You explain things better than any book or person I have encountered. You really really get your stuff and I (along with many others) really appreciate your knowledge sharing. Your articles are the holy grail for those who really want to understand these concepts. You should write a book on machine learning algo’s explained. I’d buy it!
Thanks Jason,
I do have plans to write a book with hands on application of all the case studies on YOU CANalytics along with data, exercises, and R / Python codes. The idea behind this book is to recreate actual thought process and effort of real data science and business analytics projects. I will need to take a few months off my schedule to draft this book, hopefully you will see something soon.
is the book out soon?
For now it is all on this blog. Will update about the book once I start to work on it. Thanks for checking though.
Very nicely written article.
Really one of the best explanation. I am a huge fan of yours.
Thanks. nice approach about the decomposing time series model.
Hi Roopam,
Very nice article! you got me on the “I must warn you that physicists as a community are usually mathematical, and occasionally philosophical”!
I’ll be glad to help HorsePower! Looking forward for part 2! and to “Don’t settle”!
BR.
Antoine
Great explanation Roopam…
Roopam,
I follow your blog actively. I consider the time series to be the most complicated to understand and implement in a more practical way. While doing forecasting, is there any way to get into account external interference as well? In this case, can we factor in drought conditions and sudden war or even currency exchange? Hoping to clear all my apprehensions and putting the knowledge into practical use. I am hoping to buy your book soon 🙂
Thanks Bharath,
It is possible to incorporate external factors in a time series model, however sudden war and draught are one-off events and hence you would rather not include them in the final model but study their overall effect on variable of interest (say pre and post tractor sales). Other regular interval variables like currency exchange make much more sense in the model. We will study one such variable i.e. marketing expense in latter parts of this case.
Hi Roopam,
Your blog is really great way to learn analytics. You connect the concepts behind various statistical techniques to life in a easy way. I often find books making these concepts difficult to understand and creating a disconnect between analytics professional and stakeholders (users) of analysis. Looking forward for your book.
Wow. I just found out your blog, and love it! So much to learn, and so much insights. Thank you for the great article.
I love the Blog!
Excellent article ….
thank you
Hello Roopam Sir….I definetly think you should make a youtube channel on predictive analytics. I am sure people like me who aspired to be data scientist and predictive modelling expert will learn a lot from it.
Thanks, Vikrant. Will keep this in mind. You might see something soon.
Hie Roopam!!
It is great pleasure to have accessed your resourceful blog on Time Series Forecasting using R. Your blog is so unbundling of the so much complex issues of time series analysis.
I am working on some rainfall time series data (annual totals) for 58 years. I want to model using ARIMA and have plotted the time series (original series) and it looks that the series is trend stationary. I further fitted a regression line and it shows a slight declining trend from the mean but insignificant. The ACF and PACF plots both show negative significant spikes at lag 6.
I further tested for stationarity of the series using KPSS and ADF and both give p-values greater than 0.05. I also performed the Box test and obtained a higher p-value. The auto.arima suggested that the model is just white noise, AR(0,0,0) Fitting the model using these parameters, I obtained just the intercept and s.e. and when I tried to get the summary of the fitted model, i obtained an output:
fit1<-arima(annual_series2, order = c(0 ,0 ,0), method = "ML", include.mean = TRUE)
fit1
summary(fit1)
Call:
arima(x = annual_series2, order = c(0, 0, 0), include.mean = TRUE, method = "ML")
Coefficients:
intercept
986.3241
s.e. 26.1365
sigma^2 estimated as 39621: log likelihood = -389.32, aic = 780.65
Training set error measures:
ME RMSE MAE MPE MAPE
Training set NaN NaN NaN NaN NaN
Warning message:
In trainingaccuracy(f, test, d, D) : test elements must be within sample
*** What does this mean? Do I need to specify the number of observations to be used, I mean specify maximum number of lags when fitting the model?
And the ACF of residuals of the the fitted model still indicate a negative significant spike at lag 6
My questions are:
1. How do I use the ACF and PACF plots of the original series to choose the model parameter? should I attempt differencing the series?
2. From which, ACF or PACF are the possible model parameters identified, I mean AR(p, d, q)
3. When forecasting, if the series is made stationary by whatever method, what series should I use to forecast? The original or the last order of making the series stationary?
Help me please
I would appreciate if you email me to [email protected]
Thanks in advance
Hi Rupam, very nicely written article. Is is possible to get the sales data used in the example in Excel (text) file format?
I am not conversant with R or SPSS, but familiar with excel. I teach first year and second year MBA students the basics of forecasting.
As a teaching tool, I want to create spreadsheet to show to students how ACF and PACF are calculated. With the data, I can actually reconstruct ACF, PACF diagrams for students and also let them play with spreadsheet and get a feel of the whole process.
Thanks and Regards
Amol
excellent article on time series analysis.
Hello Roopam,
Just wanted to thank you for your excellent blog! I like the creative story you wrap around the methodology and listing of the mechanics (in R).
Hi Roopam,
I am very new to data science field and trying to start my career in this field.Due to this i was going through so many articles online since almost last 60 days. But to my surprise the way you explained the concepts of breaking a bigger problem into smaller ones wrt data science is remarkable.
I must say its so easy that anyone can understand it and in my opinion the person who uses the language which is easy and can be understood by many have the basic concepts very clear.
Pls keep on sharing ur knowledge it can help many.
Regards,
Chiranjiv
Hi Roopam,
You have a great blog going on here. Most of the stuff out there on the internet is basic and helps aspirants in Data Science domain. But your blog is very useful for working professionals and I am glad that you have put it up together because people often forget that the ones who are actually working also require help to revisit certain topics.
Keep it up
I am a fan of your storytelling. Keep up the amazing work