
Edward Scissorhands – by Roopam
This is a continuation of the case study example of marketing analytics we have been discussing for the last few articles. You can find the previous parts at the following links ( Part 1, Part 2, and Part 3). In the last part, we discussed exploratory data analysis (EDA: Part 3). In this article we will talk about association analysis, a helpful technique to mine interesting patterns in customers’ transaction data. Association analysis can be used as a handy tool for extended exploratory data analysis. By the way, association analysis is also the core of market basket analysis or sequence analysis. Later in the article, we will use association analysis in our case study example to design effective offer catalogs for campaigns and also online store design (website).
Scissorhands
I must have been 9 or 10 years old when in our school we had our first craft lecture. Craft lectures are called SUPW in India, it’s an abbreviation for ‘Socially Useful Productive Work’. As a part of the first lecture, each student was provided with an A4 sized color paper and a pair of scissors. In the first lecture excited kids with no direction discovered that they could cut a sheet in a virtually infinite number of ways. It was neither socially useful nor productive work, and created a lot of wasted paper. A more apt long form of SUPW in this case is ‘Some Useful Paper Wasted’. Later with a more directed effort we discovered that there are so many cool shapes hidden in a piece of paper as long as scissors are used wisely.
This is precisely the kind of experience many analysts have when they come across customers’ transaction data in companies. There is wealth of information about customer behavior hidden in this data but it is hard to figure out where to start. Transaction data can be sliced, diced and grouped in infinitely many ways similar to a piece of paper dissected with scissors. The key in both these above cases is direction.
Hollywood Image of Data Analysis
 Let me describe a typical Hollywood visual for data analysis, a man standing in front of a giant screen with data (sequence of numbers) floating all over the screen. This man will detect patterns in this data on the fly. This is a powerful image but completely untrue. The above technique of stare at data and hope to find patterns is guaranteed to generate all noise and very little signal. Even the great code breakers like John Nash and Alan Turing will fail if they try to find patterns in data using this Hollywood technique.
The point I am trying to drive at here is that data analysis is a highly planned activity. As an analyst never touch your data before you have a proper plan of action (hypotheses etc.) in place. Having said this there are always going to be times as an analyst, when you have to enter uncharted territories of data to find patterns. In these cases, I will recommend you rely on machine learning algorithms or create your own modified algorithms specific to your requirements. In my opinion, machines are any day better than us humans at this task. Association analysis powered by the Apriori algorithm is one such technique to mine transaction data. Let’s explore association analysis in the next part.
Association Analysis
Association analysis, as you will discover soon, is primarily frequency analysis performed on a large dataset. Since datasets for most practical problems are large you need clever algorithms like Apriori to manage association analysis.Let’s consider a much smaller transaction dataset to learn about association analysis. Here, each row or transaction number represents market baskets of customers. For the subsequent products columns, 1 represents ‘bought the product in that transaction’, whereas, 0 stands for ‘did not buy’.
| Transaction # | Shirts | Trousers | Ties |
| 001 | 1 | 1 | 1 |
| 002 | 0 | 1 | 0 |
| 003 | 1 | 0 | 1 |
| 004 | 1 | 0 | 1 |
| 005 | 1 | 1 | 0 |
There are a few association analysis metrics (i.e. support, confidence, and lift) that are really helpful in deciphering information hidden in this kind of dataset. Let us explore these metrics and understand their usage. Support for purchase of shirts and ties together in association analysis is defined as:

For our data there are 3 transactions with both shirts and ties (shirts∩ties) out of total 5 transactions.

60% is a fairly high value for support and you will rarely find such high values for support in real world examples. For real world problems with several product groups, support of 1% or at times even lower depending upon the nature of your problem is also useful.
Confidence for association is calculated using the following formula:

In our dataset, there are 3 transaction for both shirts and ties together out of 4 transactions for shirts. The calculation for confidence for our dataset is:

Again you will rarely find such high value of confidence for most real world problems unless there are appealing combo offers on two products. A good value of confidence is again problem specific.
A third useful metric for association analysis is lift; it is defined as:

Expected confidence in the above formula is presence of ties in the overall dataset i.e. there are 4 instances of ties purchase out of 5.
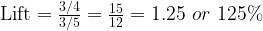
The value for lift, 125%, shows that purchases of the ties improve when the customers buy shirts. The question you are asking here is that if the customer buys a shirt, does his chance of buying ties go up i.e. value of lift above 100%. Let us use our knowledge about association analysis for the case study example we have been working on.
Retail Case Study Example – Association Analysis
 DresSMart Inc., where you are the Chief Analytics Officer & Business Strategy Head, is an online retail store for clothes and apparel. They showcase different products, brands, and styles. You know association analysis works best when performed separately on different customer segments (read about customer segmentation). However, you have decided to do a quick association analysis on the data available in your company.
With your data for formal shirts and ties we explored in the above example, you got support of 0.2% with confidence of 12% and lift of 509%. This implies that though there are fewer percentage records of transactions with both ties and shirts, once the customers buys formal shirts his chances of buying a tie goes up five fold.
DresSMart provides the option to it’s customers to return the undamaged product back within 30 days with full refund. You did a further investigation of customers who are buying ties along with shirts and found that product return rates of the ties for these transactions are also 3 times more than the other return rates. This is an indicator that customers are struggling to choose matching ties while placing the orders online along with shirts. There is a need to improve this process on the company’s website. The idea is to reduce product return rate while exploiting the full opportunity for cross selling ties with shirts.
You have found some good clues to improve the profitability of your company through exploratory data analysis tools. Now you want to prepare and address the original objectives (Part 2) to improve profitability for campaign efforts. You will delve into serious modeling for this task next time around.
Sign-off Note
Hope you enjoy being Edward Scissorhands with your data! See you soon with the next part of this case study example where we will explore more about decision tree algorithms.
Hi roopam,
Liked the article. I wanted to know how feasible is it using association analysis for online path analysis and clickstream data. For example, how two different page urls are used and so on. How can I use apriori algorithm for improvement of the model?
Thanks in advance.
Poonam
Thanks Poonam, I am glad you enjoyed this article.
The way you have described your problem, I don’t see a reason why association/sequence analysis won’t work. The only thing you may have to keep in mind is that if the number of page urls are too high (say 500 or more) then you may want to categorize them into broader categories before doing your analysis.
For the Apriori algorithm you can use ‘arules’ package in R. Association analysis is not so much a model but a method to create simple rules using frequency & basic probability analysis. Hence, the Apriori algorithm is not to improve any models but to find these rules efficiently. I hope this helped let me know if you need any further help.
Cheers
Hi Roopam,
You are awesome ,Innovate resourceful teacher ,,.. Thank you for your wonderful articles
I have read almost all of your articles. But I didn’t find any article on Maximum likelihood estimator(MLE).
Request you to write article on OLS VS MLE vs Bayesian Estimator with examples.
Thanks Rajanna for the kind words. I am really happy you are enjoying the articles. Will discuss Maximum Likelihood and other techniques in some later articles.
could you please list in here the URLs of the previous three parts pf this blog?
Here you go: Part 1, Part 2, and Part 3
Roopam, thanks for presenting this articles. i came up with the following situation while doing the association rules. Please let me know how to select the best rule in the following situation.
support confidence lift rule
0.5 0.6 2.86 lhs= Rin rhs=surf excel
0.5 0.6 2.86 lhs= Rin rhs=dettol
0.4 0.5 2.86 lhs= diaper rhs=surf excel
Thanks
Good job turning this case study into a an interesting story. Like a good book, I can’t put it down before I learn how it ends! Thanks for educating the world on how useful yet not frightening data analysis can be.
Thank you, I am really happy you are enjoying this case, and learning from it.
Hello Roopam,
Thanks for publishing such an informative article in a simple layman’s term.
Pls do let me know if am missing out something here:
Expected confidence -P(Ties) should be read as 3/5 as i can see only 3 ties were bought per this dataset, however you have mentioned 4/5 in ur calculation. Pls correct my observation.
Expected confidence in the above formula is presence of ties in the overall dataset i.e. there are 4 instances of ties purchase out of 5
Thanks Abhinav, that was a typo have corrected it.
Excellent material, thanks a lot! 🙂
The links to parts 1,2 and 3 are dead, would be nice to read the whole series.
Some glitch with WordPress. Try now.
You could find the whole series at this link : http://ucanalytics.com/blogs/category/marketing-analytics/retail-case-study-example/
Hi Roopam,
Thank you very much for these case studies. I am preparing for my Data Science Consultant interviews these days and these are helping me a lot. The next rounds in most companies I am interviewing with is Analytical Case Study. The HR described it as, “they will give a scenario, aks for what data will u need, what algos can you run, what are the risks involved etc”. Leaving your blog, I haven’t found many other good case studies which reflect the scenario I am most likely to get.
I have a question and some requests:
1) How should I come up with risks for any particular scenario? Is there a framework involved?
2) Apart from the Case Studies that you currently have on the blog, are there any more that you can share.
3) Can you point me to any other blogs/posts/videos/links you have come across which contain similar work?
Thank you very much. This is awesome work and is most likely helping a lot of people.
Thanks.
1) How should I come up with risks for any particular scenario? Is there a framework involved?
Risk is an extremely wide concept but analytically think of it as the probability of things going outside the expected business boundaries. You may find this credit risk case study useful http://ucanalytics.com/blogs/category/risk-analytics/banking-risk-case-study-example/
There are several great websites with good explainations of statistical & machine learning tools and coding. However, I didn’t come across any website focusing completely on creative business problem solving and case studies – the way data science professionals do it in the real world. This was precisely the reason I started this blog. Am glad it helped you. All the best.
Hi, Roopam,
Though I am new to data analytics and you can say zero experience in Algorithm. As of now have been basically instinctive based. Point that you made data analysis is more planning then instinct is awesome… I hope to learn from your blog. Decided to go through each of the post that you have posted…
Regards,
Sushant
you are really good store teller ( with concept). I must say I enjoyed each and every line .
thanks a lot