Telecom Case Study – Customer Segmentation

Customer Segmentation – by Roopam
For the last few articles we have been working on a telecom case study to create customer segments (Part 1, Part 2 and Part 3). In this case, you are the head of customer insights and marketing at a telecom company, ConnectFast Inc. Recall, in the first part, you have created cluster centroids through iterative calculation of Euclidean distances. Remember, the objective of iterative calculations was to adjust the centroids to place them at the center of the cluster members (see Part 1). Have a look at the animation below (you have seen this data in part 1 of this series); with each iteration Standard Sum of Error (SSE) is reducing. For the time being, don’t worry about the calculation of SSE but try to understand its purpose. In the animation, we started with 29 as the original value of SSE for the original random seeds and converged to stabilized SSE of 7 for the final iteration (further iterations won’t change SSE or positions of cluster centroids). This is absolutely the objective to iteratively reduce SSE till it gets stabilized – and voila! You have found your cluster centroids / black holes (see Part 1). As discussed in the previous article most machine-learning algorithms try to iteratively converge to an optimal solution. For cluster analysis the idea is to minimize SSE iteratively. I hope you have noticed, this is somewhat similar to Archimedes’ method of converging to the value of π (discussed in the previous article).
Customer Segmentation
Coming back to the case study, you are at the final stages of customer segmentation exercise to form clusters based on customers’ services usage behavior. As a telecom company ConnectFast offers several services on top of their existing cellphone plan (with prepaid and postpaid billing), some of them are listed below
- National/international calling
- National/international roaming
- 2G/3G/4G internet plans
- National /international data roaming
Before moving further, let us try to generate some intuitive feel for customer segmentation using cluster analysis. For simplicity let us consider just 3 different services (i.e. variables: international/ national roaming, and 3G) with 4 levels each (i.e. attributes: non-usage, low, medium and heavy usage). This is displayed in the adjacent figure. Theoretically, there could be (4)3 or 64 maximum clusters that can be formed. However, after our analysis for customer segmentation we have generated just 4 clusters (displayed as orange customer segments). Let us take a pause and think about it for a while, there are 64 difference locations where customers could be found based on their services usage behavior. However, the major density of customers is located at 4 clusters detected through cluster analysis. I hope you could see some relationship with universe and galaxies (discussed in Part 1) here, the mass is concentrated in limited areas with majority of white space.
For ten variables that you will be using in your analysis for ConnectFast, with 4 levels each you could have a little more than one million clusters i.e. (4)10. Now one of the biggest challenges with cluster analysis, as also discussed in a previous article, is to choose the right number of clusters before the analysis. That is you need to know the exact number of clusters that you are going to form before you run your cluster analysis through K-mean algorithm (K is the number of clusters one wants to form or the number of initial cluster seeds you provide to the algorithm). The best solution to the above challenge is a mix of analytical methods and business acumen to arrive at the initial number of cluster seeds. Business acumen is something you generate over a period of time by developing intuitive feel about the business. In the next segment, let us focus on the analytical procedure to form optimal customer segments.
Optimizing the Number of Clusters
 One of the useful analytical methods to choose the optimum value of K is to plot stabilized SSEs vs. the number of cluster seeds (i.e. different value of K in the K-mean clustering). An illustration for this is shown in the adjacent figure (Graph A). This is the graph you have got for your own analysis with the ConnectFast’s data and 10 variables. On a technical note, an outer loop that performs cluster analysis with incremental value of K generates the values for this kind of plot. You have plotted the same with number of clusters seeds on the horizontal axis and minimum or stabilized SSE on the Y axis. There is a significant drop in the value of SSE as you have moved from 9 initial cluster seeds to 10. Your business sense justifies the presence of 10 customer segments hence you have decided to stick with it.
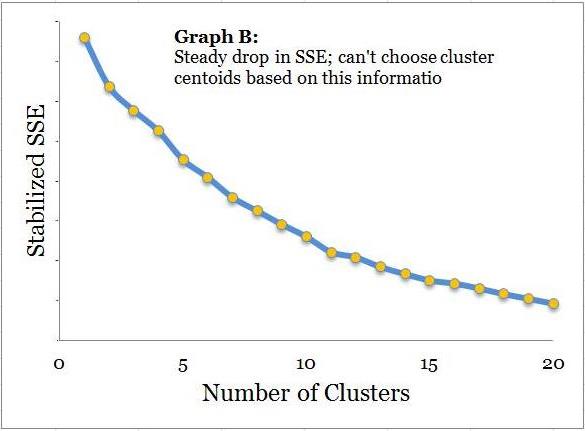 You are feeling good because you know you were lucky with the output plot. The definitive clues you have got from plotting SSEs and cluster numbers may not have been as clear i.e. you might have got a smooth line as shown in the adjacent plot (Graph B). In this case you may have to rely completely upon your business sense. Now you are left with a final task for customer segmentation of naming these clusters based on their attributes.
You have completed the task of naming the 10 customers segments. The customer segments are arranged in the descending order of value to the company. The following are the highest and lowest value customer segments
1) Affluent corporate – very high spenders, have more than 4 services activated, high-usage on most services, predominantly senior management in large corporates, frequent foreign/domestic travelers, and high profit to the company
…
10) Stingy prepaids – low spenders, barely use one service, run their phone on minimum prepaid amount, mostly enjoy free incoming calls, and high cost to the company
After naming the customer segments you have performed some quick analysis on some of the company’s key performance Indicators (KPI). In your analysis you have found some crucial information that you will share with the CEO and the COO of the company to redefine the company’s business strategy.
An Application of Customer Segmentation
 For the last few years there is a special emphasis on customer attrition or churn rate – a concern for the industry after implementation of number portability by the telecom regulators. The chief operating officer (COO) of the company was set on the task to keep a close check on the churn rate as a major part of his responsibility when he joined four years ago. There is a constant communication to product managers on the field to keep a close tab on customer churn. On top of the things their effort is certainly showing positive influence as the churn rate is gradually decreasing (shown in the adjoining figure). However, if we analyze the churn rate across different segments we will get a completely different picture.
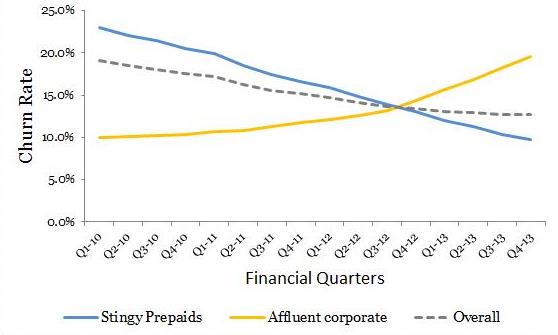 Let us have a look at customer churn rate across two segments with the highest and lowest value to the company. Shockingly, the churn rate for ‘Affluent corporate’ (the highest value customer) is steadily increasing at a worrying pace. On the other hand, ‘Stingy prepaids’ are enjoying the hospitality of the company and showing steady decline in 18 months vintage churn rate. The rates for these two segments are counterbalancing the overall churn. This is certainly a strong evidence for the management to modify their business strategy and focus on right business metrics.
Sign-off Note
What we have seen in the above case study is not very unusual. These signals about portfolio deterioration often go unnoticed until it is too late for dynamic customer portfolios – where the customers are moving in and out at a high velocity and volume. Creation of static frames or cohorts along with customer segmentation is a very helpful analytical tool to keep a close tab on building a healthy customer base. See you soon with a new topic.
Good job mate. This is really helpful. keep it up!
Thanks Graham.
Good one Roopam, Simple and systematic explanation.
Thanks Azim
The analysis has been very clearly put across. Very helpful
Agreed…clearly explained analysis. I have one question though…how did you create the longitudinal segmentation? You depict a graph showing churn from 1st Q 2010 to Q4 2013…how were the segments created that allowed you to look across these 4 years of data?
Thanks Thomas, actually the segments / clusters were made point-in-time with the data for say a couple of quarters. After that the same segments were monitored over a period of time for customer churn. New customers are tagged to the clusters using a classification algorithm.
However,there are a couple of things one needs to keep in mind while performing this analysis i.e.
1) Temporal stability of cluster members – the clusters should be reasonably robust i.e. customers should not frequently migrate from one cluster to another. This can be monitored using segments’ transition matrix.
2) Population / portfolio stability of segments – the number of clusters should stay reasonably stable for the customer base over time. This is monitored using cluster deviation and similar metrics to ensure overall population is stable around the clusters.
Hope this helped!
Great! Thank you. Statistically and methodologically, how did you define “same clusters?” I ask because, in practice, it’s not as straightforward and easily answered a question as it sounds.
I hope I am getting your question right. When I say same clusters, it is about tagging new customers to the clusters based on the customers’ behavior / demography. This actually is not a very difficult task after you have made your classification model using say decision trees. However, I agree clustering itself is a highly exhausting exercise for the analysts since it involves several non-standardized methodologies and business judgement calls at every stage of the analysis.
Let me try and clarify what I’m asking…I think you said that you started with 2 quarters of customer data. These quarters were probably Q1 and Q2 of 2010, but you should correct me if that’s inaccurate. Then, with those customers as your base, you built a predictive classification model using a tree-based approach. Subsequently, from Q3 2010 forward, each new customer was assigned to one of the segments using the rules from the predictive classification model.
So far, so good? Please correct any inaccuracies…
The question is, why are these new customers churning out so quickly?
That’s a great observation Thomas, thanks for reading the post and figures with such detailed attention. I really appreciate that!
Actually, the churn rates are for customers with 18 months vintage (as also mentioned in the post). So when you read Q4-2013 the rate is for the customers on-boarded 6 quarters ago or in Q2 of 2012 (Q4 2013 is the measurement date). The same graph can be recreated based on on-boarding quarters of the customers, in that case all the X-axis titles (quarters) will shift by 6 quarters. However, the overall trend and other aspects for the line graph will stay the same. Churn rate is usually monitored for a seasoned or matured customer portfolio. However, one can also modify the vintage according to business objectives (for instance if you are measuring quick mortality for the portfolio vintage will be a couple of quarters). Also for churn models / survival analysis the definition of vintage will need much more detailed analysis.
Roopam-
Thanks for the additional info! The methodological questions are one thing. Were you able to develop some motivating factors for why the one segment had such an elevated rate of churn? Was it simply that their contracts ended and they moved on to other, more recent handsets available from other vendors? I just wonder why their needs were so clearly not being met.
Tom
The illustration I have used in this case is exaggerated and fuzzed up to make a clear statement for the readers without revealing confidential information. So don’t read too much in there. However, I could divulge just a minor detail from my experience (without breaching confidentiality). Most of the times it is the incentive structure for feet-on-the-street that creates a mismatch of this sort. Chasing KPIs without well thought-out scientific measurement strategy usually results in similar scenarios and outcomes.
Best thing about your articles is simplicity , i go through them in the first place before checking out other more deep and complicated sources.
Please keep the good work up (Y)
Hi Roopam,
I wanted to know what is stabilized SSE on the Y axis in the above plot to determine the number of clusters ?
Hi Nitin,
Every physical system has a tendency to stabilise to a state of equilibrium. When SSE is getting stabilised it is essentially achieving a state of dynamic equilibrium – this is similar to state of our universe. Mathematical construct of SSE is just trying to replicate this state. Hope this helped.
“Creation of static frames or cohorts along with customer segmentation is a very helpful analytical tool to keep a close tab on building a healthy customer base.” Definitely..
Awesome post! Very informative, I enjoyed reading it 🙂
Hi Roopam,
I wanted to understand how you assign entities(in this case customers) from test data, to the already created segments(using the training data). I need to build a similar churn model for a bank. Although I have clear idea about developing classification models however, I do not know how to use segmentation and then score the new population.
Thank you very much. Excellent Case Study. Look forward to more of these.
Thank you very much for case study. Maybe I can found full database of this case?